Figure 4.
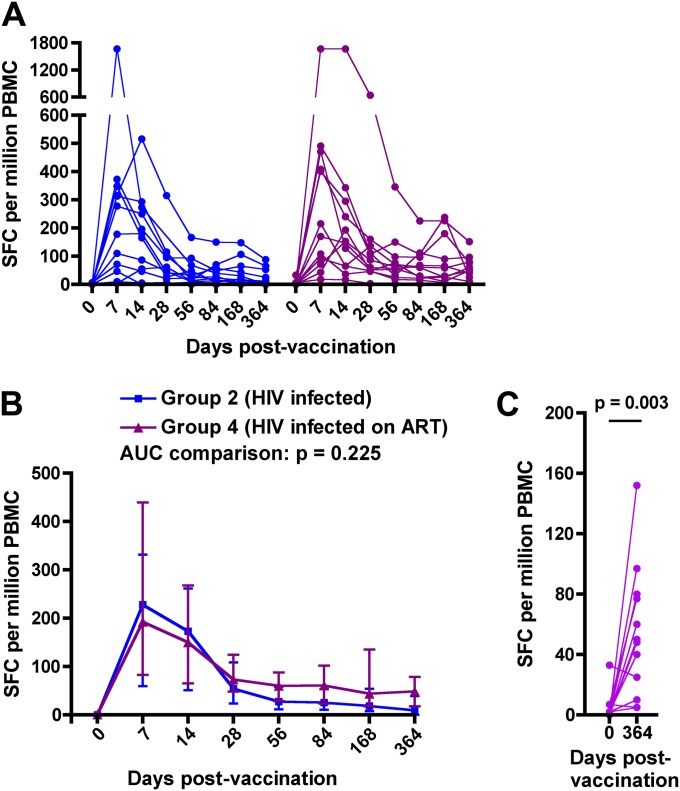
Effect of antiretroviral treatment in HIV-infected adults on MVA85A-induced Ag85A-specific IFN-γ enzyme-linked immunospot (ELISPOT) responses. (A) Longitudinal responses in individual participants from group 2 (n = 12, HIV infected) and group 4 (n = 12, HIV infected, receiving antiretroviral therapy [ART]). Ten group 4 participants had positive IFN-γ ELISPOT responses to Ag85A 7 days postvaccination. (B) Medians (lines) and IQRs (error bars) of Ag85A-specific IFN-γ ELISPOT responses. Area under curve (AUC) comparisons of the groups were evaluated by Mann-Whitney U test. An adjusted P value of less than 0.025 was considered significant for the AUC comparisons. (C) Comparisons between the Ag85A-specific T-cell response before (Day 0) and 1 year after (Day 364) MVA85A vaccination in group 4 (n = 12, HIV infected, receiving ART). Differences were evaluated by Wilcoxon matched pairs test. SFC = spot-forming cells.

