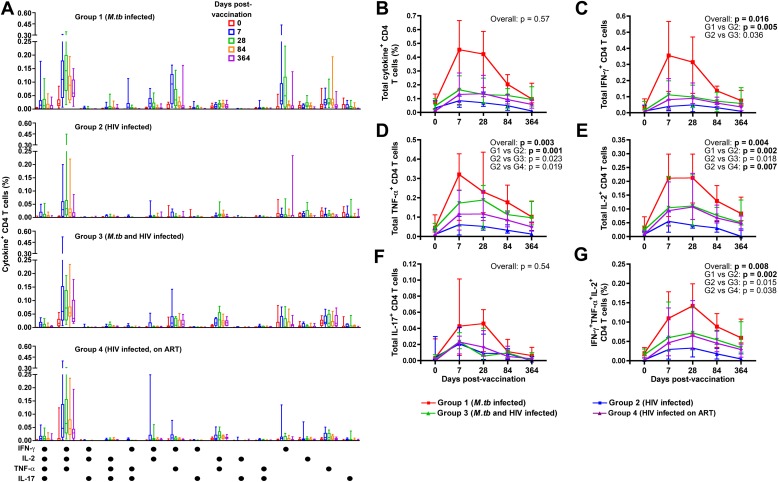
Figure 6.
Ag85A-specific CD4 T-cell cytokine expression in whole blood measured before and after MVA85A vaccination by flow cytometry. (A) The graphs show patterns of single or combined expression of IFN-γ, IL-2, tumor necrosis factor (TNF)-α , and/or IL-17 by CD4 T cells from adults in group 1 (Mycobacterium tuberculosis [M.tb] infected, n = 12), group 2 (HIV infected, n = 12), group 3 (M.tb and HIV infected, n = 12), and group 4 (HIV infected, receiving antiretroviral therapy [ART], n = 12). The median frequency for each cytokine-expressing cell subset is represented by the horizontal line, the interquartile range (IQR) by the box, and the range by the whiskers. For each pattern, in each individual, background values (unstimulated) were subtracted. Each box plot represents a particular time point pre- or postvaccination, for the indicated cytokine-expressing cell subset. (B–G) Medians (lines) and IQRs (error bars) of Ag85A-specific CD4 T-cell frequencies measured before and after MVA85A vaccination in the four groups. (B) Total cytokine-expressing CD4 T cells. (C) Total IFN-γ–expressing CD4 T cells. (D) Total TNF-α–expressing CD4 T cells. (E) Total IL-2–expressing CD4 T cells. (F) Total IL-17–expressing CD4 T cells. (G) Polyfunctional CD4 T cells, coexpressing IFN-γ, TNF-α, and IL-2. Comparisons of area under curve (AUC) values for the groups were evaluated by Kruskal-Wallis test (overall effect), followed by the Mann-Whitney U test. An adjusted P value of less than 0.0083 (Bonferroni adjustment, 0.05 × 6) was considered significant. Significant differences are shown in boldface.

