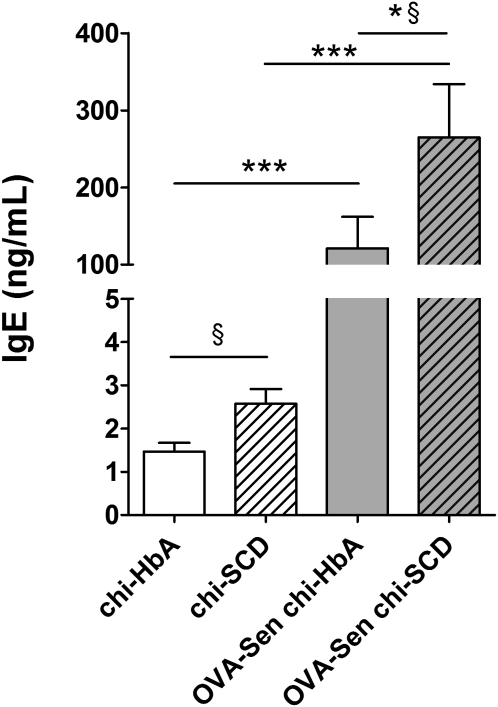
Figure 3.
Total IgE. Total IgE was quantified by ELISA and values compared with known IgE standards. §P < 0.05 directed comparison of Non-Sen chi-HbA mice with Non-Sen chi-SCD mice and OVA-Sen chi-SCD mice with OVA-Sen chi-HbA mice. *P < 0.05, comparing OVA-Sen chi-SCD mice versus OVA-Sen chi-HbA mice. ***P < 0.001, comparing OVA-Sen chi-HbA mice versus Non-Sen chi-HbA mice and OVA-Sen chi-SCD mice versus Non-Sen chi-SCD mice (n = 7–12). Open bars, chi-HbA mice. Hatched bars. chi-SCD mice. Shaded bars, OVA-Sen chi-HbA mice. Shaded hatched bars, OVA-Sen chi-SCD mice.

