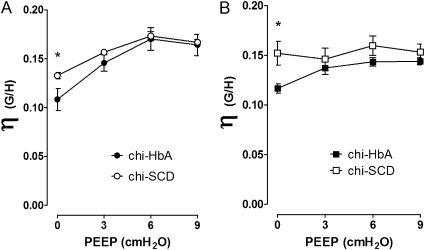
Figure 6.
Changes in hysteresisity (η = G/H), a sensitive measure of pulmonary resistance, in response to increasing PEEP levels. An increase in η suggests that lung is stiffer, resulting from increased collagen deposition and/or a greater number of alveolae becoming filled with fluid. The η curves were generated by dividing G data by H data in Figure 5 and plotting the result against the four increasing levels of PEEP (0, 3, 6, and 9 cm H2O). Closed circles, chi-HbA Non-Sen mice. Open circles, chi-SCD Non-Sen mice. Closed squares, chi-HbA OVA-Sen mice. Open squares, chi-SCD OVA-Sen mice. *P < 0.05.

