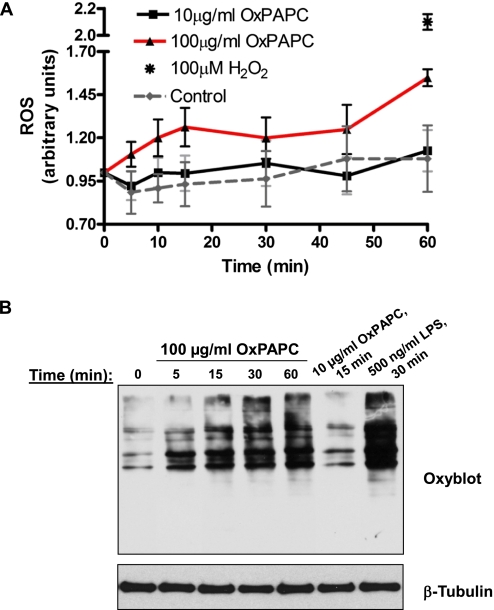
Figure 2.
OxPAPC-induced production of reactive oxygen species (ROS) and protein oxidation in OxPAPC-treated ECs. (A) Cells were treated with 10 μg/ml or 100 μg/ml OxPAPC, and ROS production was measured with a fluorogenic marker for ROS in live cells (carboxy-2′,7′-dichlorodihydrofluorescein diacetate), as described in Materials and Methods. The stimulation of ECs with H2O2 (100 μM, 60 minutes), as indicated by an asterisk, was used as a positive control. All experiments were repeated three times. Values represent means ± SDs, pooled from three independent experiments. (B) Analysis of protein oxidation. Cells were stimulated with 10 μg/ml OxPAPC or 100 μg/ml OxPAPC for different periods of time and lysed. The treatment of ECs with LPS was used as a positive control. Extracted proteins were derivatized with 2,4-dinitrophenylhydrazine (DNPH), electrophoretically separated, blotted, and used for anti-DNPH immunostaining, as described in Materials and Methods. The results shown are representative of three independent experiments.

