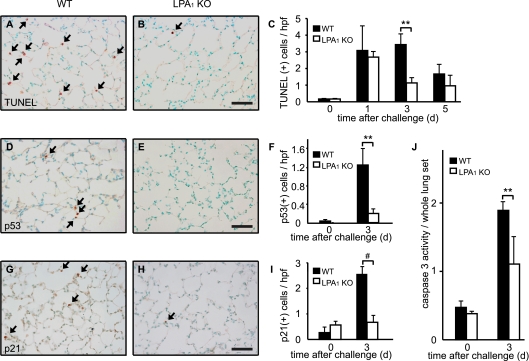
Figure 1.
Bleomycin-induced alveolar epithelial apoptosis was attenuated in the lysophosphatidic acid receptor (LPA1) knockout (KO) mice. (A–C) The increase in terminal deoxynucleotidyl transferase dUTP nick end labeling (TUNEL)+ cells induced by bleomycin in the alveolar epithelium was attenuated in LPA1 KO mice. Representative TUNEL/peroxidase-stained sections of (A) wild-type (WT) and (B) LPA1 KO mouse lungs 3 days after bleomycin challenge. Scale bars = 50 μm for all images. (C) Mean numbers of TUNEL+ cells per high-power field ± SEM in lung sections of WT and LPA1 KO mice at Days 0, 1, 3, and 5 after bleomycin challenge. Data were pooled from two independent experiments; the combined numbers of samples were n = 3 (Day 0) or 6 (Days 1, 3, and 5) for WT and LPA1 KO mice. **P < 0.01, WT versus LPA1 KO mice at Day 3 after bleomycin challenge; significance for this comparison, and for all subsequent comparisons performed for experiments with only two experimental groups, was determined by two-tailed Student's t test. (D–F) The increase in p53+ cells induced by bleomycin in the alveolar epithelium was attenuated in LPA1 KO mice. Representative p53/peroxidase-stained sections of (D) WT and (E) LPA1 KO mouse lungs 3 days after bleomycin challenge. (F) Mean numbers of p53+ cells per high-power field ± SEM in WT and LPA1 KO lung sections at Day 0 and Day 3 after bleomycin challenge. n = 3 (Day 0) or 7 (Day 3) for each genotype. **P = 0.01, WT versus LPA1 KO mice at Day 3. (G–I) The increase in p21+ cells induced by bleomycin in the alveolar epithelium was attenuated in LPA1 KO mice. Representative images of p21/peroxidase-stained sections of (G) WT and (H) LPA1 KO mouse lungs 3 days after bleomycin challenge. (I) Mean numbers of p21+ cells per high-power field ± SEM in WT and LPA1 KO lung sections at Day 0 and Day3 after bleomycin challenge. n = 3 (Day 0) or 7 (Day 3) for each genotype. #P < 0.001, WT versus LPA1 KO mice at Day 3. (J) Mean caspase 3 activity/whole lung set ± SEM measured in WT and LPA1 KO lung homogenates at Day 0 and Day 3 after bleomycin challenge. n = 7 to 10 for each genotype at each time point. **P = 0.01, WT versus LPA1 KO mice at Day 3.

