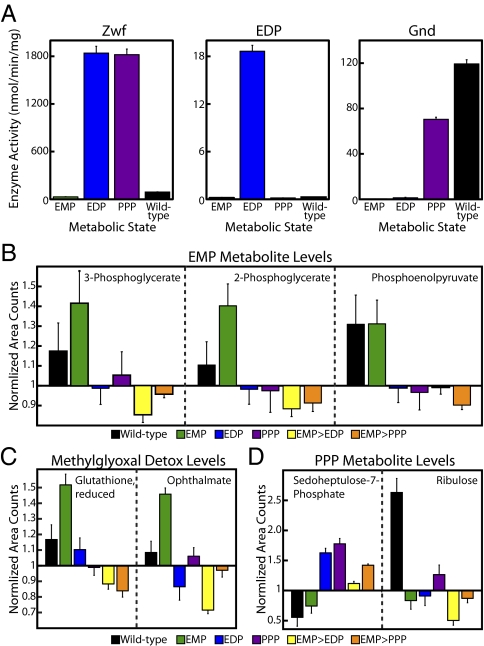
Fig. 5.
Metabolism switchboard performance. (A) Protein scale. Activities of Zwf, the EDP, and Gnd in nanomolars per minute per milligram. Graphs depict the triplicate mean ± SEM. (B–D) Metabolome scale. Using mass spectrometry, raw area counts for identified biochemicals were normalized by the total protein concentration and then rescaled by setting the median value equal to 1.0. Missing values were imputed with the minimum value. Graphs depict the sextuplicate mean ± SEM. (B) Levels of EMP intermediates. (C) Levels of methylglyoxal detoxification intermediates. (D) Levels of PPP intermediates.

