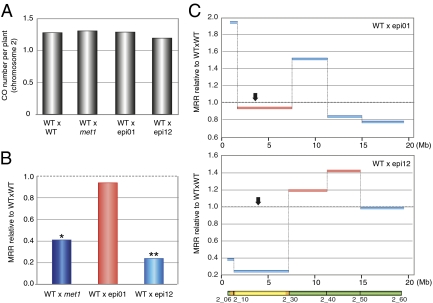
Fig. 4.
The combination of DNA hypomethylation and inbreeding affects MRR in epiRILs. F2 plants originating from the cross between WT and epi01 (WTxepi01) and WT and epi12 (WTxepi12) were genotyped for SNPs by using KASP markers. (A) Total number of COs per plant for chromosome 2 for the four F2 populations. (B) MRR at the centromeric region of chromosome 2. MRR obtained from F2 plants originating from two different F1 plants is presented relative to WTxWT MRR and is compared with the data obtained from the cross between WT and met1 mutant (WTxmet1, blue bar). The bars are color-coded to indicate the global methylation status of the parental epiRIL at the analyzed heterochromatic intervals (light blue, met1-like methylation; light red, WT-like methylation). Dotted lines mark the WTxWT MRR set at 1. *P < 0.001; **P < 0.0001 (ANOVA). (C) Relative MRR (WTxepi01 relative to WTxWT, Upper; WTxepi12 relative to WTxWT, Lower) is represented along chromosome 2 (arrow, centromere; Mb, coordinates in Mb; gray dotted lines, WTxWT MRR set at 1).

