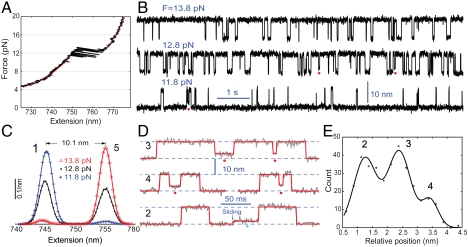
Fig. 1.
Formation of staggered coiled coil states through protein misfolding or helix sliding. (A) Force-extension curve (black) of a single pIL molecule. The curve was obtained by separating the two optical traps at a speed of 20 nm/s. A similar curve was measured by relaxing the molecule (not shown). The regions below or above the transition region can be fit (red line) by the work-like chain models for both DNA and polypeptide (SI Appendix), yielding a polypeptide contour length increase of 25.8( ± 0.8) nm due to coiled coil unfolding. (B) Extension-time traces of a single pIL at indicated pulling forces. Data were mean-filtered using a 2.2 ms time window. Red dots indicate the partially folded and staggered states. (C) Probability density distributions of extensions corresponding to the traces in (B) (symbols) and their double-Gaussian-function fit (lines). (D) Close-up view of the extension traces showing the misfolded states (red dots) and intermediate state (cyan dots). Data were mean-filtered using a 1 ms time window. The red lines are the corresponding fit based on the hidden-Markov model. (E) Histogram distribution of the average extensions for the staggered states relative to the folded state. The scaled relative average extensions of the staggered states measured at all trap separations are included. The distribution can be fitted by a triple-Gaussian function, resolving three misfolded states and their relative positions. The total five states involved in pIL transition are numbered as States 1–5 in (C) and (E), with the staggered states numbered in black for traces in D.

