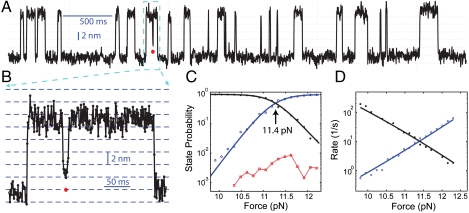
Fig. 4.
Misfolding of pER into staggered states. (A) Extension-time trace filtered using a time window of 2.2 ms. (B) Close-up view of the misfolded state in the region indicated in (A). Data is shown at 1 kHz. (C) Force-dependent probabilities of the protein being in folded (black), misfolded (red), and unfolded states (blue). (D) Force-dependent transition rates of folding (black) and unfolding (blue). The probabilities and rates were fitted to a two-state model, yielding the best-fit lines shown in (C and D). For simplicity, the misfolded states were neglected in the model due to its low probability.

