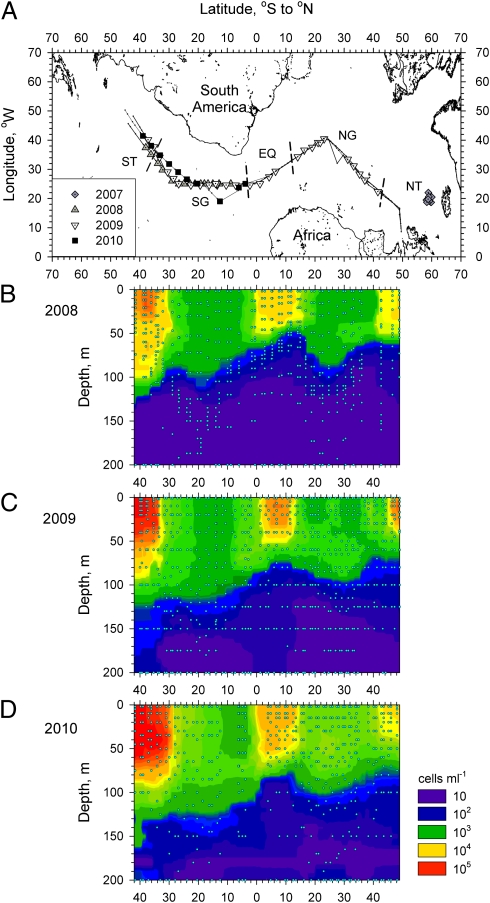
Fig. 1.
A schematic map of the Atlantic Ocean showing the area sampled in the 2008, 2009, and 2010 cruises (A) with corresponding contour plots of the vertical distribution of Synechococcus cyanobacteria in 2008 (B), 2009 (C), and 2010 (D). These distributions were used to identify the boundaries of the five oceanic regions: Northern temperate waters, Northern subtropical gyre, equatorial waters, Southern subtropical gyre, and Southern temperate waters. Short dashed lines (A) indicate these boundaries. Solid lines with dots (A) indicate the ship tracks and sampled stations, respectively. Circles (B–D) indicate sampled depths. The stations sampled in 2007 in North Atlantic temperate waters are also indicated.

