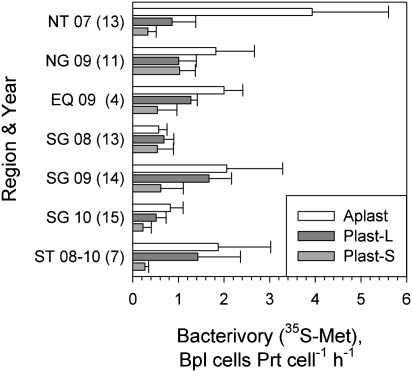
Fig. 2.
A comparison of mean rates of cell bacterivory by flow-sorted aplastidic, large plastidic, and small plastidic protists in the five regions (see Fig. 1 for details). The numbers next to the region abbreviations indicate the year of sampling, and the numbers in parentheses indicate the number of separate experiments performed in each region. The rates were calculated using [35S]methionine pulse–chase tracing. Error bars show single SDs to indicate the variance of rates within regions. The results of an earlier study conducted in 2007 in North Atlantic temperate waters (19) are included for comparison.

