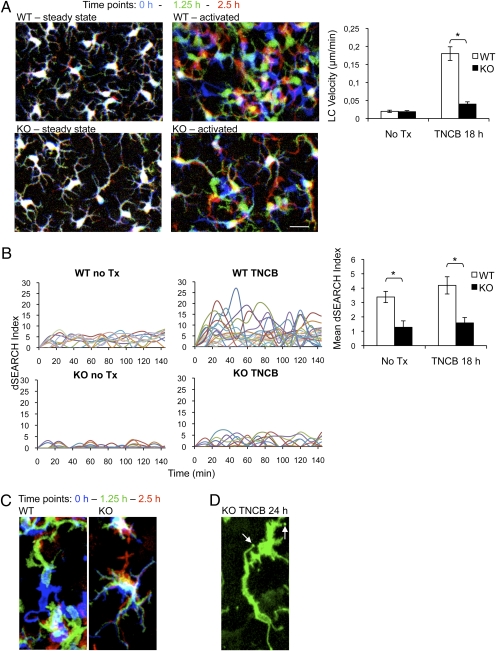
Fig. 7.
Decreased LC motility in LC/EpCAM-cKO mice demonstrated via intravital microscopy. (A) Two-photon imaging was performed on ears of anesthetized LC/EpCAM-cKO (KO) and WT mice expressing EYFP in LC that were untreated (steady state) or were treated with 1% TNCB 18 h before imaging (activated). Images were acquired every 2 min for 2.5 h, and 3D stacks (steady state, z = 11 μm; activated, z = 18 μm) were projected into 2D. (Left) LC positions are represented with a red/green/blue color code with time 0 in blue, 1:15 h in green, and 2:30 h in red. (Scale bar: 10 μm.) (Right) Velocities of cell body movements that were determined for approximately 50 cells per condition and analyzed with ImageJ using the Manual Tracking and Chemotaxis plugins. *P < 0.01. (B) dSEARCH indices were determined in EYFP-expressing LC in WT and KO mice that had been treated with TCNB 18 h before analysis and were compared with indices in untreated KO and WT mice. (Left) Aggregate dendrite position changes of 10 individual LC (indicated in different colors) per group (measured at 12-min intervals over a 144-min observation period. (Right) Aggregate mean dSEARCH indices of 50 individual LC per group at steady state or 18 h after ears were painted with 1% TNCB (12-min intervals over 2.5 h). *P < 0.0001. Data represent means ± SEM. (C) Cell body displacement of MHC Class II-EGFP–labeled LC 18 h after TNCB painting (z = 18 μm, projected into 2D). Color coding is as in A. (D) Immotile dendrite tips (arrows) of MHC Class II-EGFP–expressing, EpCAM-deficient LC 24 h after TNCB painting (z = 18 μm, projected into 2D).

