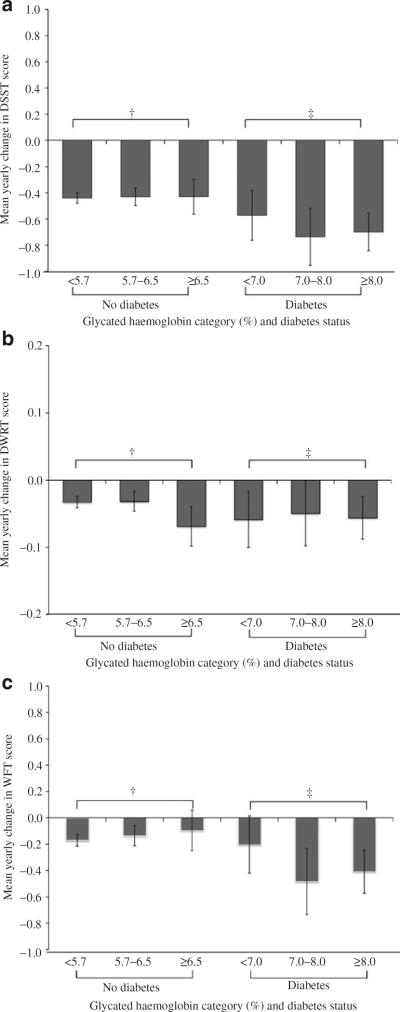
Fig. 1.
Mean yearly change in cognitive test scores by HbA1c category and diabetes status adjusted for age, race, sex and education: a DSST, overall trend p<0.001; †p=0.831; ‡p=0.509. b DWRT, overall trend p<0.032; †p<0.055; ‡p=0.722. c WFT, overall trend p=0.005; †p=0.231 and ‡p=0.226. The p value for trend represents the linear trend of mean yearly change in test score across HbA1c for no diabetes and diagnosed diabetes groups, separately. The p value for overall trend represents the linear trend of mean yearly change in test score across HbA1c categories for all participants (no diabetes and diagnosed diabetes combined). Error bars represent 95% CI

