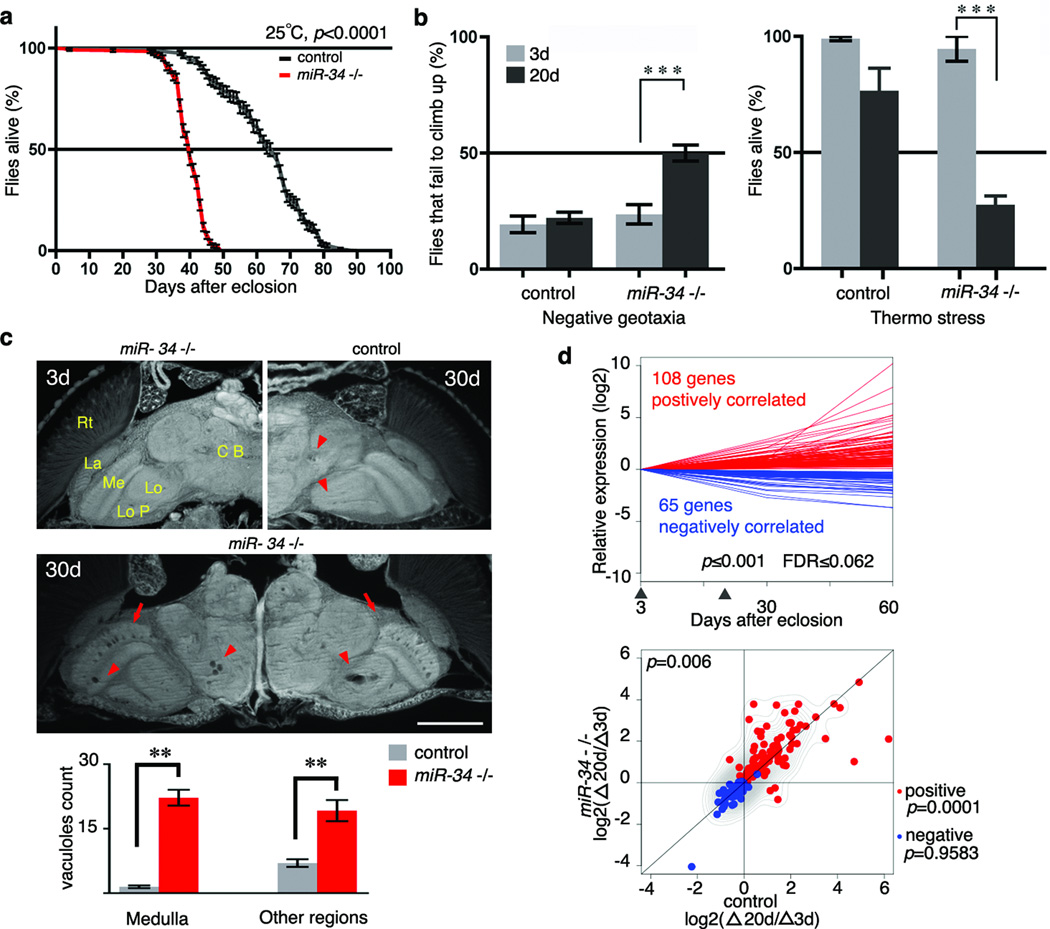
Figure 2. miR-34 modulates age-associated processes.
a. miR-34 mutant flies have a shortened lifespan (control: 64d median, 90d maximal lifespan; miR-34: 40d medium, 64d maximal lifespan; p<0.001, log-rank test). Mean ± s.e., n≥240 male flies per curve. Genotypes: control: 5905. miR-34 −/−: miR-34 null-1 in 5905 homogenous genetic background.
b. miR-34 mutant flies have late-onset behavioral deficits. Left panel, for locomotion behavior, miR-34 mutant flies have normal climbing at 3d. At 20d, 50±3.4% miR-34 mutant flies fail to climb; in contrast, only 22.1±2.4% of control flies have defective climbing. Mean ± s.e.m. of 3 experiments, n=120–140 male flies per experiment. Right panel, for stress resistance, miR-34 mutant flies have normal resistance to heat stress at 3d. miR-34 mutant flies become strikingly sensitive to heat shock with age, such that at 20d, only 27.5±3.8% survive after heat stress. In contrast, 76.7±9.6% of control flies survive after the same treatment. Mean ± s.e.m. of 3 experiments, n=120–140 male flies. *** =p<0.0001 (two-way analysis of variance). Genotypes as in a.
c. miR-34 mutant flies show age-associated brain degeneration. Top left panel, miR-34 mutant flies have normal brain morphology at 3d. Major anatomical structures: CB (central brain), Lo (lobula), LoP (lobula plate), Me (medulla), La (lamina) and Rt (retina). At 3d, control flies have normal brain morphology (not shown), but develop a small number of sporadic vacuoles at 30d (top right panel, arrowheads). Middle panel, aged miR-34 mutants (30d) show striking vacuoles in the medulla (arrows) and other regions of the brain (arrowheads). Bottom, the number of vacuoles in miR-34 mutants is significantly higher than in controls (22.2± 1.8 vs 1.5±0.3 in medulla; 19.2±2.5 vs 7.0±0.9 in other regions of the brain; **=p < 0.001, one-way analysis of variance, with post test: Tukey's multiple comparison test). Mean ± s.e.m., n=10 independent male fly brains. Genotypes as in a. Scale bar: 0.1mm.
d. miR-34 mutant flies have a transcriptional profile indicative of accelerated aging. Top panel, 173 age-correlated probesets were defined from a transcriptional profile of fly brains at 3d, 30d, and 60d of age. Arrowheads indicate time points (3d and 20d) at which miR-34 mutants and controls were compared. Genotype: iso31 flies used for transcriptional profiles of normal aging brains. n=3 biological replicates for each time point. p≤0.001, FDR≤0.062, linear regression model. Bottom panel, scatter plot illustrates the relative expression of 173 probesets, which shows a significant difference between miR-34 mutants and age-matched controls (p=0.006, two-sample, paired Wilcoxon test). Whereas the pattern for positively-correlated probesets (red), indicated by the contour lines, is significantly different (p=0.0001) between the two genotypes, and tend to show higher expression in miR-34 mutants compared to controls, it is not for negatively-correlated probesets (blue) (p=0.9583).). Contour lines indicate that positively correlated probesets tend to show higher expression in miR-34 mutants compared to controls. Genotypes as in a. n=5 biological replicates for each time point.

