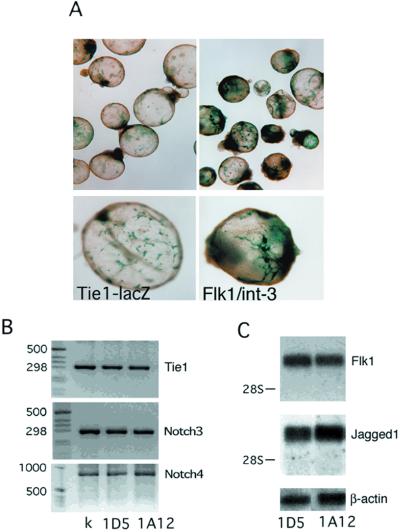
Figure 5.
EBs composite. (A) EBs were generated from either Tie1-lacZ or Flk1/int-3 (40× or 100× magnification, respectively). The endothelial cells in EBs were visualized by β-galactosidase staining. (B) RT-PCR analyses for Tie1, Notch3, and Notch4 were carried out by using RNA derived from kidney (k), control EBs (1D5), and Flk1/int-3 EBs (1A12). (C) Northern blot analysis was used to detect Flk1, Jagged1, and β-actin transcripts in control EBs (1D5) or Flk1/int-3 EBs (1A12).

