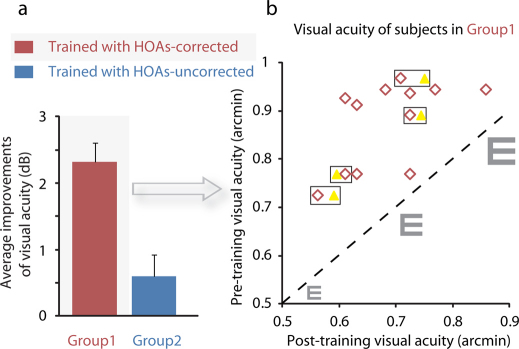
Figure 2. Improvements of visual acuity after training in Group1 (red) and Group2 (blue).
Visual acuity associated with 75% correct identification was measured with the Chinese Tumbling E Chart at HOAs-uncorrected condition, and converted to MAR acuity. (a) There were significant improvements of visual acuity in Group1 (Paired Samples Test, t(12) = 9.16, P = 0.00000091, 2-tailed), but not in Group2 (Paired Samples Test, t(7) = 1.42, P = 0.20, 2-tailed). (b) Visual acuity of all subjects before and after training in Group1. Abscissa represents visual acuity after training; ordinate represents visual acuity before training. Each red '◊' point represents one subject. The dashed line indicates a prediction of no improvement. The 4 yellow ' ' points represent visual acuity retested 5 months after training for 4 subjects (the corresponding pre-/post-training results of these 4 subjects are shown by red '◊' points that are marked by black '□').

