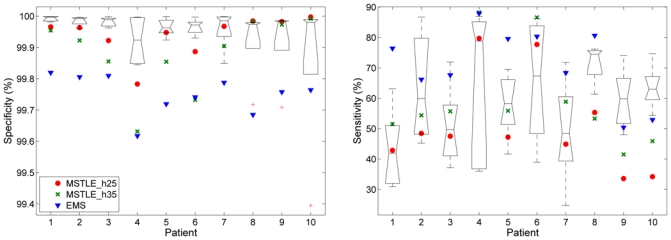
Fig. 11.

The boxplot shows the median and the quartiles of the specificity (left) and sensitivity (right) of the raters using the STAPLE algorithm using clinical data and the points show the results for the automatic methods: TLEMS_h25 and TLEMS_h35 and EMS. Experts segmented twice each image, the first manual segmentations were employed to create the STAPLE silver standard and the second ones were employed to evaluate the specificity and sensitivity of the experts.
