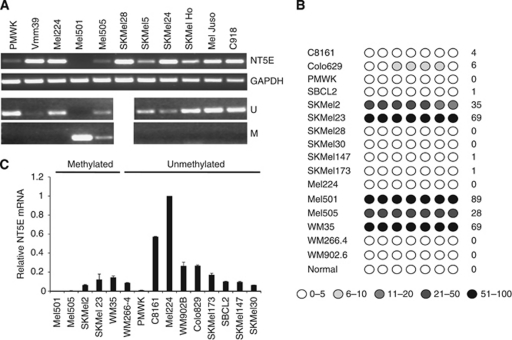
Figure 2.
Analysis of NT5E expression and methylation in malignant melanoma. (A) Expression of NT5E correlates inversely with CpG methylation in melanoma cell lines. The upper panels are RT–PCR analysis of NT5E and the control gene GAPDH in melanoma cell lines as indicated. Lower panels are MSP analysis of the NT5E CpG island in the same cell lines. There is complete methylation in Mel501 and partial methylation in Mel505. (B) Pyrosequencing analysis of the NT5E CpG island in a panel of melanoma cell lines. Pyrosequencing was done as described in Materials and Methods. The level of methylation is represented by the intensity of shading in the circles, each of which represents an individual CpG dinucleotide in the amplified fragment. The mean % CpG methylation in the amplified fragment is also shown. (C) qPCR analysis of NT5E mRNA levels in panel of melanoma cell lines. Data shown are means of at least three duplicates±1 s.d.

