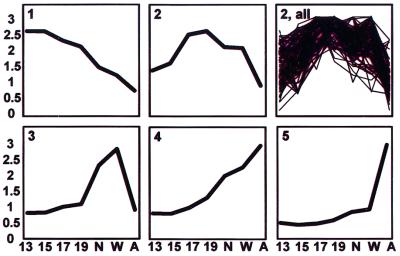
Figure 4.
Temporal gene expression profiles during kidney development. Data are expressed as the mean at each time for clusters of genes as defined by k-means clustering (1–5). The distribution of individual profiles is also shown for the most heterogeneous group (2, all). Identities of representative genes are shown in Table 1. 13, 15, 17, 19, embryonic days; N, newborn; W, 1 week old; A, adult.

