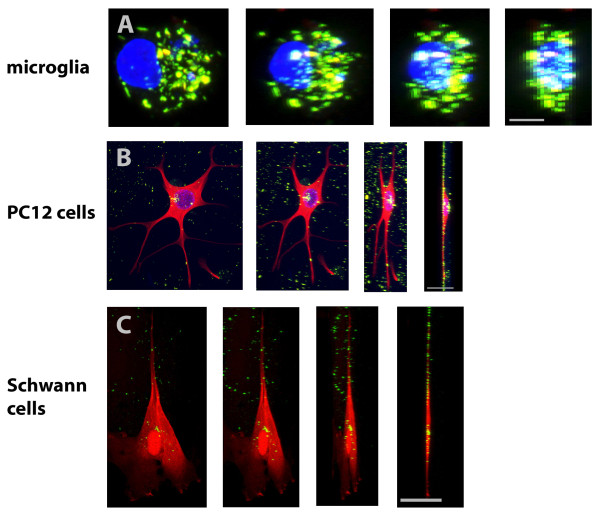
Figure 3.
Representative confocal 3-D-projections of cells. Representative confocal 3D projections of a microglial cell in (A), PC12 cell in (B) and Schwann cell in (C) with MNP uptake. Image rotation is shown from left (frontal) to right (side view). Green fluorescent MNPs rotated in correlation to the nucleus and cell bodies. Additionally, MNPs were coplanar to the cell bodies indicating real uptake of MNPs in the cells. Bar represents 5 μm in (A) and 25 μm in (B) and (C).

