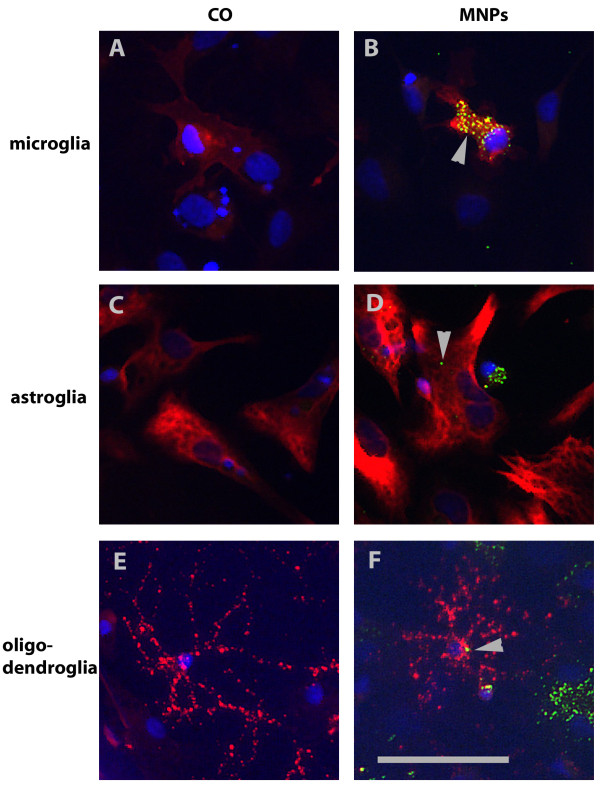
Figure 8.
Representative fluorescent images of glia cells in cerebellar cultures. Cell type specific stainings are shown in red and MNPs in green (arrows). Microglia were stained with anti-CD11b/c, shown in (A) and (B), astroglia with anti-GFAP, in (C) and (D), and oligodendroglia with anti-GalC, in (E) and (F), antibodies. Glia cells in (A), (C) and (E) represent control cells, cells in (B), (D) and (F) were incubated with 50 μg/ml MNPs for 24 h. Bar represents 50 μm.

