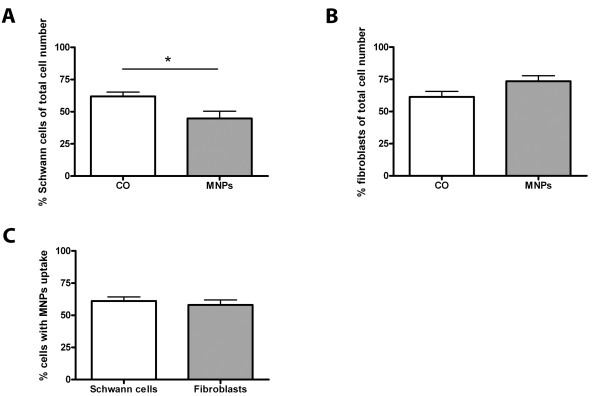
Figure 9.
Quantitative analysis of primary Schwann cell/fibroblast cultures after 24 h incubation with 50 μg/ml MNPs. All values are expressed as mean ± SD. In (A), the number of Schwann cells is compared between cells of the control and cells incubated with MNPs. MNP incubation decreased the percentage of Schwann cells. The comparison of control cells and cells incubated with MNPs for fibroblasts is shown in (B). The number of fibroblasts in the cultures was not influenced by MNP incubation. (C) shows the comparison of the uptake for both cell types. The number of cells which took up MNPs was similar in both cell types.

