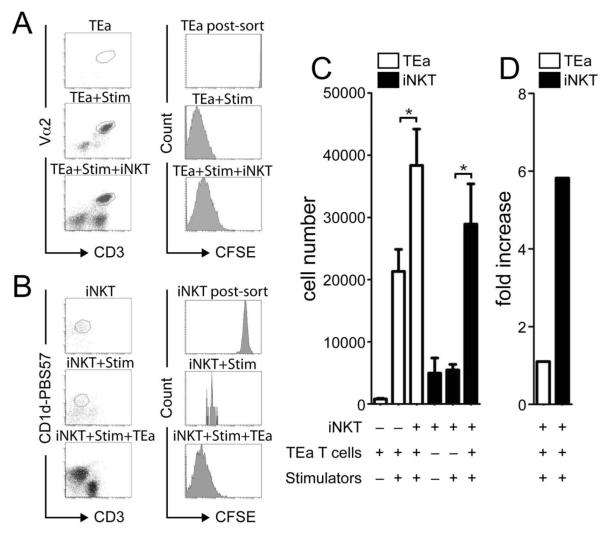
Figure 2. iNKT cells are expanded in the presence of conventional T cells alloresponses.
The proportion of TEa T cells and iNKT cells proliferating during co-culture with stimulators was determined by CFSE labelling. On day 4 post culture, TEa T cells and iNKT cells CFSE profile was determined (A-B) and both cell number (C) and fold expansion (D) calculated following culturing alone, with stimulators or together with stimulators. Data is presented as the mean of triplicate cultures ± s.d. of one experiment. *p=<0.05. Data is representative of 3 independent experiments.

