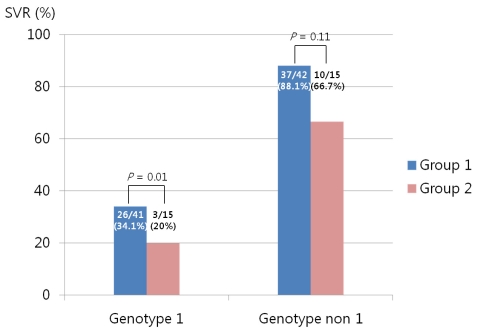
Figure 2.
Comparison of virologic responses in patients with or without rapid normalization of an initially abnormal ALT level according to genotype. Group 1, initially abnormal ALT level with rapid normalization (i.e., within 1.5 times the normal range of ALT level by 4 weeks after starting treatment). Group 2, initially abnormal ALT level without rapid normalization (i.e., not within 1.5 times the normal range of ALT level by 4 weeks after starting treatment). Levels of statistical significance (i.e., P) were calculated using the chi-squared test. SVR, sustained virologic response.

