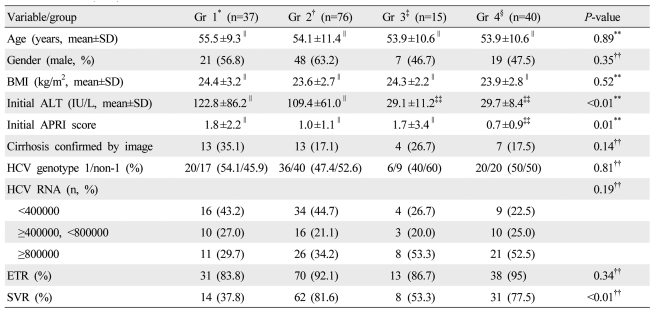
Table 1.
Baseline demographic, clinical characteristics, and virologic responses in patients with different patterns of change in alanine aminotransferase (ALT) level during treatment (n=168)
*Patients who had initial abnormal ALT levels and sustained abnormal ALT levels during treatment; †Patients who had initial abnormal ALT levels and obtained normalization of ALT; ‡Patients who had initial normal ALT levels and variable ALT abnormality during treatment; §Patients who had initial normal ALT levels and sustained normal ALT levels during treatment; ††Chi-squared test; **Anova test; ∥,‡‡Same symbols indicate no statistical significance based on Turkey's HSD post-hoc test.
BMI, body mass index; ALT, alanine aminotransferase; APRI, AST (aspartate amine transferase) platelet ratio index; HCV, hepatitis C virus; ETR, end treatment response; SVR, sustained virologic response.

