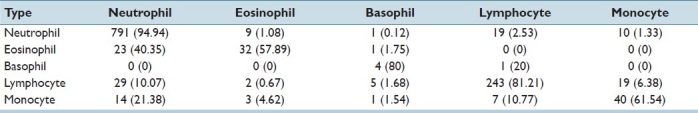
Table 1.
Confusion matrix for the comparison method (five subtypes)[6,7] Rows represent the correct classification by experts. For each row, the columns represent the classification made by the approach used in the comparison method. The classification percentages made by the algorithm is enclosed in brackets. Diagonal entries indicate correct classification and are indicated in bold