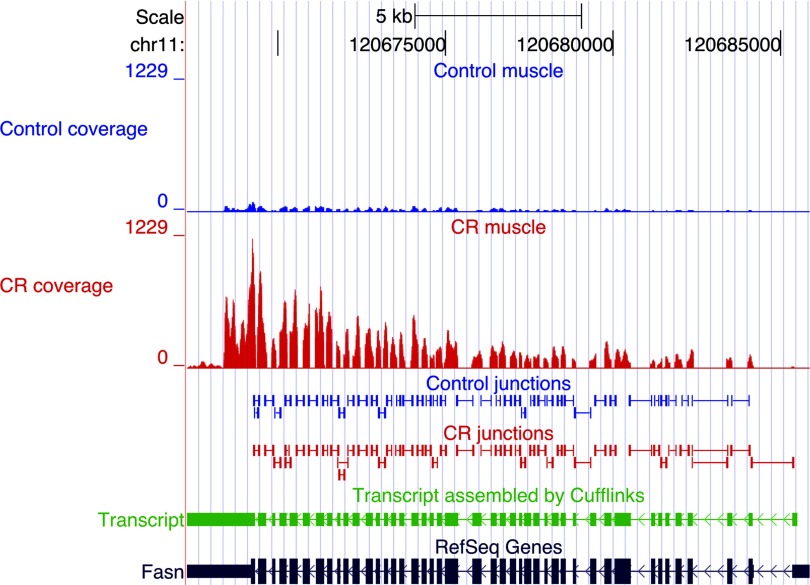
Fig. 1.
mRNA-Seq analysis of fatty acid synthase (fasn) gene expression. Shown here is a UCSC browser view illustrating the fasn gene with sequence coverage depth (quantity of reads, y-axis) at the top [blue, control; red, calorie restriction (CR)]. The peaks mark expressed exons and are consistent with RefSeq annotation (dark blue at bottom). Differential expression of the fasn gene is indicated by the considerably fewer reads mapping to the exons in the control than in the CR sample. Splice junctions identified by Tophat from control and CR datasets are shown below the sequence alignments; all known splice junctions were detected. The fasn transcript assembled by Cufflinks independently of any gene annotation is shown in green; it coincides precisely with the RefSeq annotation.

