Fig. 3.
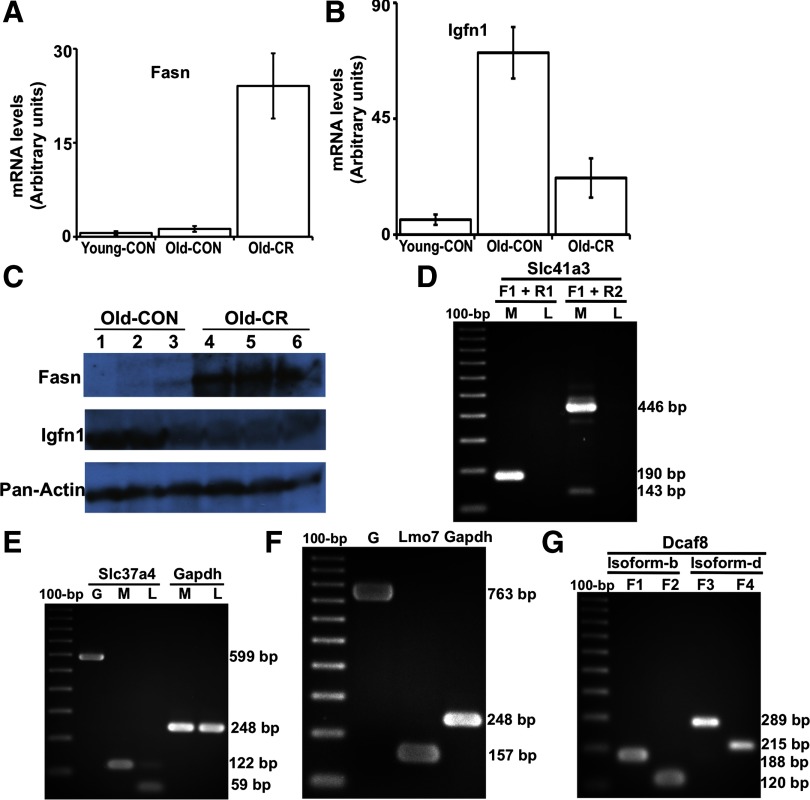
qPCR and Western blotting: validating the differential expression of fasn and igfn1 and agarose gels of RT-PCR products verifying the expression and splicing of novel exons. A: qPCR validation of the differential expression of fasn. The change in gene expression identified by mRNA-Seq were confirmed with qPCR by comparing mRNA levels from old control and old CR samples. We also added a young control group to measure the age effects on fasn muscle expression (n = 4 for each of the 3 groups). CR induced fasn expression, but age did not affect it. mRNA levels were normalized to GAPDH control. B: qPCR validation of the differential expression of igfn1. The change in gene expression identified by mRNA-Seq were confirmed with qPCR by comparing mRNA levels from old control and old CR samples. Age increased igfn1 expression, but CR suppressed the age-associated increase. C: Western blots showing the level of fasn, igfn1, and pan-actin in protein samples extracted from the skeletal muscle of old control and old CR mice (n = 3 for each group). D: expression and splicing of the novel exon in the Slc41a3 gene locus shown in Fig. 4. The forward primer specific to exon 1 (F1) and reverse primer specific to exon 2 (R1) were designed to amplify a 190 bp product from isoform-a which includes the second exon. The forward primer specific to exon 1 (F1) was also used with a primer specific to exon 3 (R2) to amplify a 446 bp product that further validated isoform-a, and a 143 bp product that validates isoform-b, which lacks the second exon. The lanes are labeled as M (muscle cDNA) and L (liver cDNA). Neither isoform is expressed in the liver. E: expression and splicing of the novel exon in the Slc37a4 gene locus shown in Fig. 5. The primers amplify a 599 bp product from genomic DNA (lane G), a 122 bp PCR product from muscle cDNA (lane M) when the novel exon is expressed and included in the transcript, and a 59 bp PCR when the novel exon is excluded. Both isoforms were expressed in the liver (lane L), but only the transcript that included the novel exon was expressed in muscle. A pair of primers to amplify cDNA of glyceraldehyde-3-phosphate dehydrogenase (Gapdh) was used as a control. F: expression and splicing of the novel leader exon in the Lmo7 gene locus shown in Fig. 6. The primers amplify a 763 bp product from genomic DNA (lane G) and a 157 bp PCR from muscle cDNA, verifying the expression and splice junction of the novel exon. G: expression of the leader exons of the novel isoforms b and d in the Dcaf8 gene locus shown in Fig. 9. A forward primer (F1) that maps to an intronic region of the RefSeq canonical Dcaf8 is designed to be specific to exon 1 of the novel isoform-b. The primer F1 amplifies a 188 bp product from muscle cDNA when used with a reverse primer specific to exon 2 (R1), verifying the expression of the novel leader exon of isoform-b. A second forward primer (F2), downstream of F1 amplifies a shorter PCR product (120 bp) when used with the same reverse primer R1. Similarly, expression of the leader exon of the novel isoform-d was verified by a forward primer (F3) that maps to an intronic region of the RefSeq canonical Dcaf8, designed to be specific to exon 1 of isoform-d. The primer F3 amplifies a 289 bp product from muscle cDNA when used with a reverse primer (R2) specific to exon 2 of isoform-d, verifying the expression of the novel leader exon of isoform-d. A second forward primer (F4), downstream of F3 amplifies a shorter PCR product (215 bp) when used with the same reverse primer R2. Primer sequences are shown in Supplemental Table S11.

