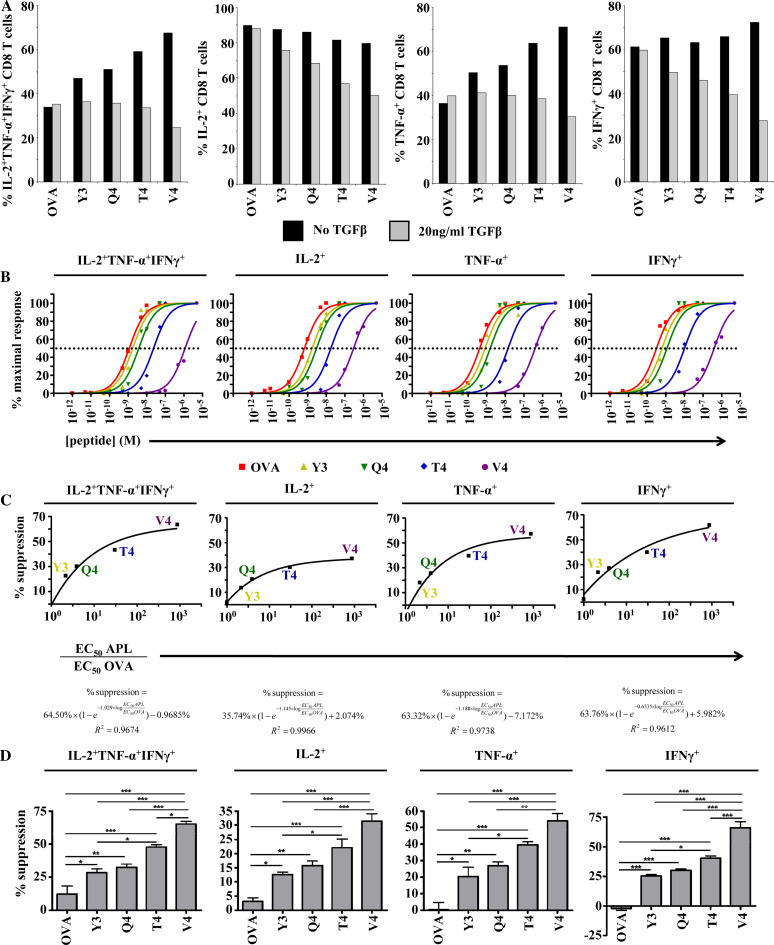
Fig. 2.
Degree of TGFβ-mediated suppression is dependent on the affinity of the ligand on which CD8+ T cells are primed. a CD8+ T cells were primed and restimulated as shown in Fig. 1. Bar graphs indicate the percentages of CD3+CD8+CD44hi cells producing all three cytokines or producing each cytokine, regardless of whether these cells produced any other cytokines. b OT-I splenocytes were stimulated in vitro for 8 h with decreasing concentrations of OVA257 or the APLs. Following stimulation, cells were analyzed for polycytokine production. For each peptide, responses were normalized to the peak response. The data were fit with sigmoidal dose–response curves. Separate curves were accepted for each peptide as the extra sum-of-squares F test yielded P values less than 0.0001 for each plot. A dotted line denotes 50% maximal stimulation. EC50 values were derived from the intersection between the sigmoidal dose–response curves and the line denoting 50% maximal stimulation. c The degree to which effector responses were suppressed by TGFβ was plotted against the derived EC50 values for each peptide relative to the derived EC50 value for OVA257. The equation defining the best-fit curve and its R 2 value is shown for each plot. d The degree of suppression of cytokine production by TGFβ was measured across four individual experiments. Columns represent mean suppression. Error bars represent standard deviation. *P < 0.05, **P < 0.01, ***P < 0.001. Suppression was defined by (% cytokine+noTGFβ − % cytokine+TGFβ)/% cytokine+noTGFβ. Data shown are representative of at least three individual experiments with similar results

