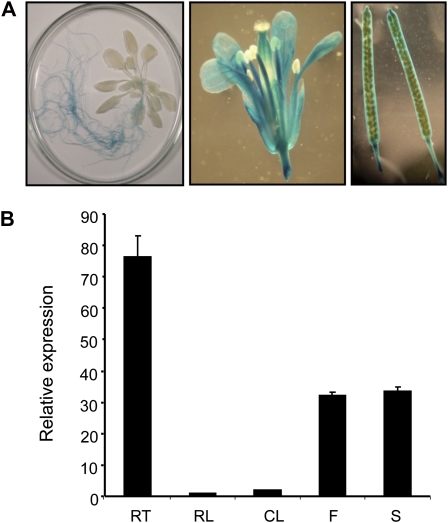
Figure 1.
Localization of PHT4;2 expression in Arabidopsis. A, Representative PHT4;2-GUS staining patterns for a 5-week-old plant (left), flower (center), and mature siliques (right). B, Quantitative RT-PCR analysis of PHT4;2 expression in wild-type plants (RT, root; RL, rosette leaf; CL, cauline leaf; F, flower; S, silique). Expression levels were normalized to EIF-4A2. Values shown are means ± se for three independent analyses.

