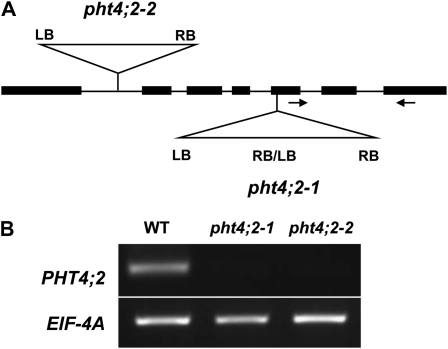
Figure 2.
Molecular characterization of pht4;2 T-DNA insertion mutants. A, Scheme indicating the positions of T-DNA insertions in pht4;2-1 and pht4;2-2 lines. Insertions were confirmed by PCR and DNA sequence. Arrows represent primers used for RT-PCR. LB, Left border; RB, right border. B, RT-PCR analysis of total RNA isolated from roots of wild-type (WT) and pht4;2 plants.

