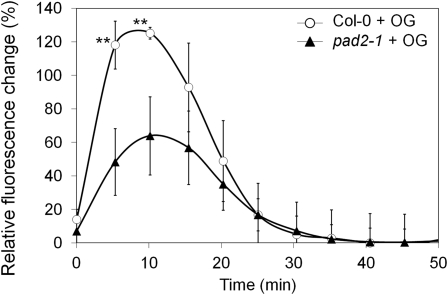
Figure 5.
Plasma membrane potential changes in response to OG treatment in Col-0 and pad2-1 cell suspensions. Cells were incubated with the voltage-sensitive fluorescent probe DiBAC4(3) (10 μm) in the dark before OG treatment (0.5 g L−1). Plasma membrane depolarization was monitored by following the variation of DiBAC4(3) fluorescence and was expressed as a relative percentage: [fluorescence (OG) – fluorescence (water)]/fluorescence (water). The chart shows mean values ± se out of five independent experiments. Asterisks indicate statistically significant differences between the wild type and pad2-1, using Student’s t test (P < 0.01).

