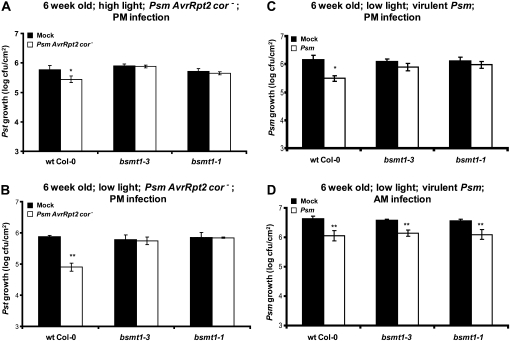
Figure 1.
Effects of different conditions on SAR development in wild-type and bsmt1 mutant plants. A and B, Growth of virulent Pst at 2 to 3 d post 2° inoculation on 6-week-old wild-type (wt) and bsmt1 mutant plants that were previously mock inoculated with MgCl2 (black bars) or inoculated with Psm AvrRpt2 cor− (SAR induction; white bars). C and D, Growth of virulent Psm strain ES4326 at 2 to 3 d post 2° inoculation on 6-week-old wild-type and bsmt1 mutant plants previously mock inoculated or Psm infected. Photon flux density of 140 μE m−2 s−1 (high light) was used in A, while 70 μE m−2 s−1 (low light) was used in B through D. The 1° and 2° infections in D were done in the morning (9:00–9:30 am) versus in the late afternoon for A through C (5:30–6:00 pm). All experiments were done at least twice with similar results; means of three replicates ± sd are presented. Asterisks directly above each set of white/black bars indicate statistically significant differences (* P < 0.05, ** P < 0.01, Student’s t test) between Pst (or Psm) growth in plants induced for SAR by Psm AvrRpt2 cor− (or Psm) versus growth on mock-inoculated controls for each genotype. Pst growth levels among the four panels cannot be compared, since the experiments were done separately over several weeks to months and basal resistance varies somewhat from experiment to experiment; thus, each experiment has an internal control. Note that the stronger SAR observed with low light (B) compared with high light (A) was not reproducible.

