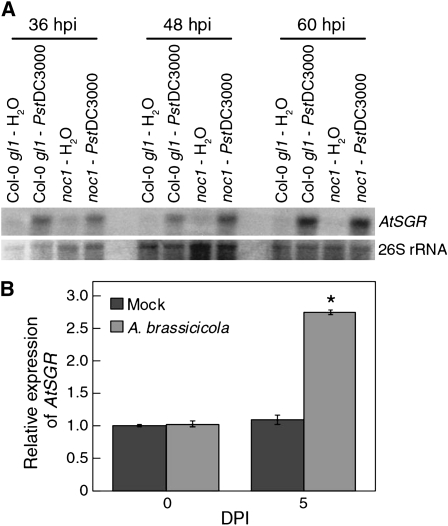
Figure 5.
Induction of AtSGR expression during infection. A, Northern-blot analysis of AtSGR expression in Pst DC3000-infected Col-0 gl1 and noc1 mutant plants. 26S rRNA visualized by ethidium bromide staining was used as a loading reference. B, Quantitative RT-PCR analysis of AtSGR expression in mock- and Alternaria-infected Col-0 gl1 plants at 0 and 5 dpi. Error bars represent sds from three biological replicates. The experiment was repeated once and similar results were obtained. Asterisks indicate significant difference (P < 0.05) between mock- and Alternaria-infected Col-0 gl1 plants using the Student’s t test.

