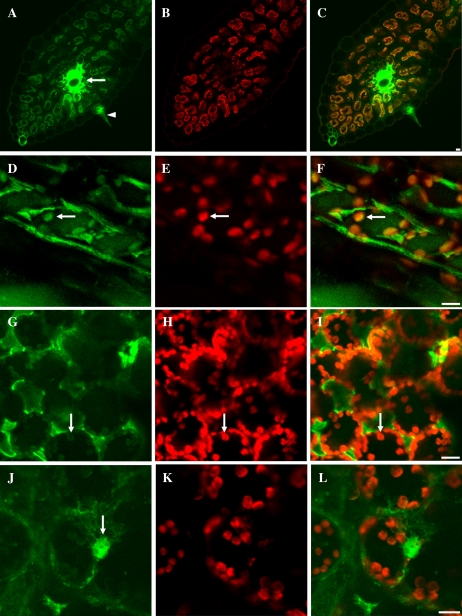
Figure 1.
Cellular distribution of fluorescein-labeled antisense ODNs (green) and Chl autofluorescence (red) in wheat (A–F) and tobacco (G–L) leaves. Low-magnification imaging of leaf blade cross sections is shown in A to C, where the arrow indicates a strong accumulation of antisense ODNs in the veins of a wheat leaf. The arrowhead in A points to a trichome with fluorescent ODNs. Merged images are shown in the right column. Arrows in D to I show chloroplast accumulation of antisense ODNs. The arrow in J shows a nucleus filled with fluorescent antisense ODNs. Bars = 10 μm.

