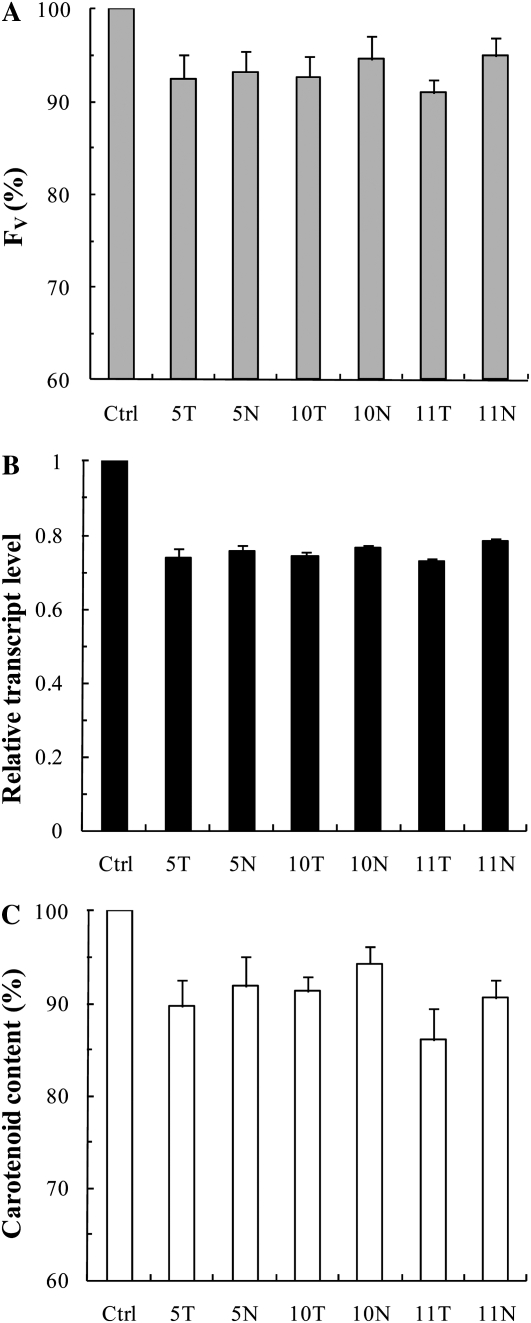
Figure 4.
Effects of pds antisense ODNs on the Chl a Fv (A), the relative transcript level (B), and the carotenoid content (C) expressed in percentage of the control in etiolated wheat leaves after 24 h of incubation. Abbreviations are as in Figure 2. The values are averages ± sd of eight measurements derived from two independent experiments.

