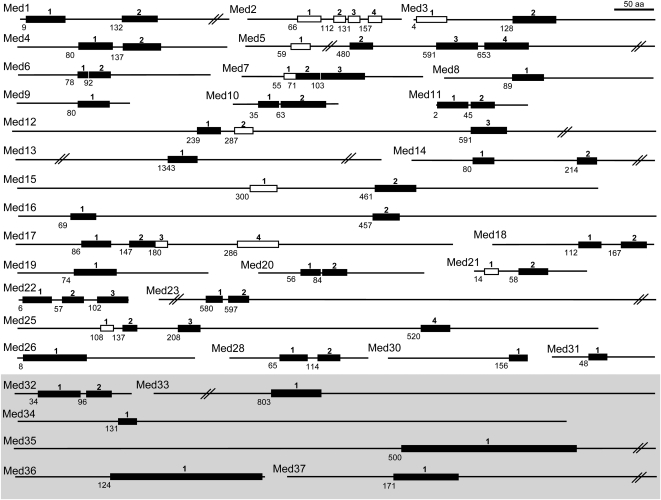
Figure 1.
The distribution of the conserved HH regions of the Med complex proteins among various eukaryotes. The HH regions (boxes) are numbered from the N terminus onward for each Med protein, represented as horizontal lines. The HH regions defining the most conserved regions in plants are shown as black boxes. The number below each HH region shows its start position relative to human or Arabidopsis (marked in the shaded area) Med proteins.

