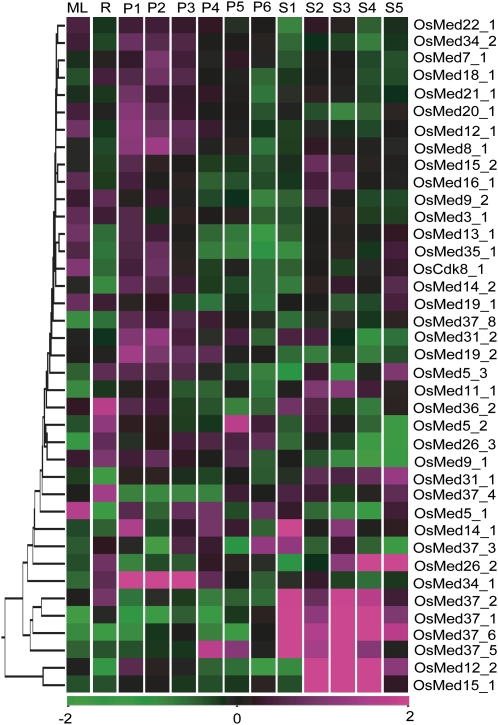
Figure 5.
Microarray-based expression analysis of selected Med genes in rice development stages. Expression profiles of at least 2-fold differentially regulated Med genes at P ≤ 0.05, with respect to the vegetative controls (mature leaf [ML] and root [R]), are shown. Developmental stages are listed at the top of each column in the temporal order of development. Reproductive stages comprise panicle (P1–P6) and five stages of seed (S1–S5) development. Hierarchical clustering of the expression profile was done with log-transformed average values, taking mature leaf as the baseline. The color scale at the bottom of the heat map is given in log2 intensity value, whereby green represents low-level expression, black shows medium-level expression, and magenta signifies high-level expression.

