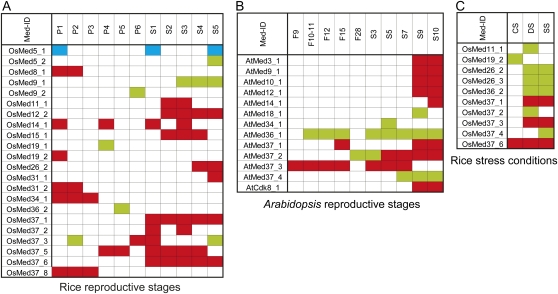
Figure 7.
Expression analysis of rice and Arabidopsis Med genes using a microarray. A, Expression profiles for genes that are more than 2-fold differentially regulated at P ≤ 0.05 in rice panicle (P1–P6) and seed (S1–S5) stages with respect to both the vegetative controls, leaf and root. Red and green boxes represent up- and down-regulated genes, respectively. A box marked in blue defines an opposite regulation in that substage with respect to leaf and root controls. B, Expression profiles for Arabidopsis flower (F9–F28) and seed (S3–S10) stages. C, Differentially expressing Med genes in rice in abiotic stress stages. CS, Cold stress; DS, desiccation stress; SS, salt stress.

