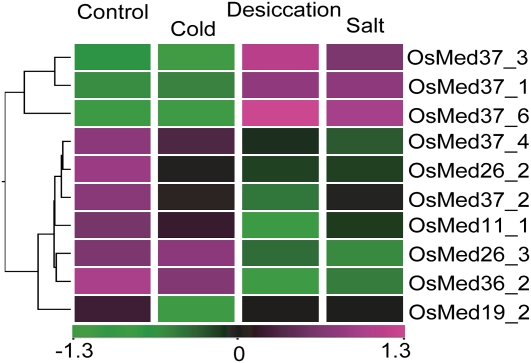
Figure 9.
Microarray-based expression analysis of selected Med genes in rice during abiotic stress conditions. Expression profiles of at least 2-fold differentially regulated Med genes at P ≤ 0.05, with respect to the control (untreated 7-d-old-seedling), are shown. Hierarchical clustering of the expression profile was done with log-transformed average values taking an untreated 7-d-old-seedling as the baseline. The color scale at the bottom of the heat map is given in log2 intensity value, whereby green represents low-level expression, black shows medium-level expression, and magenta signifies high-level expression.

