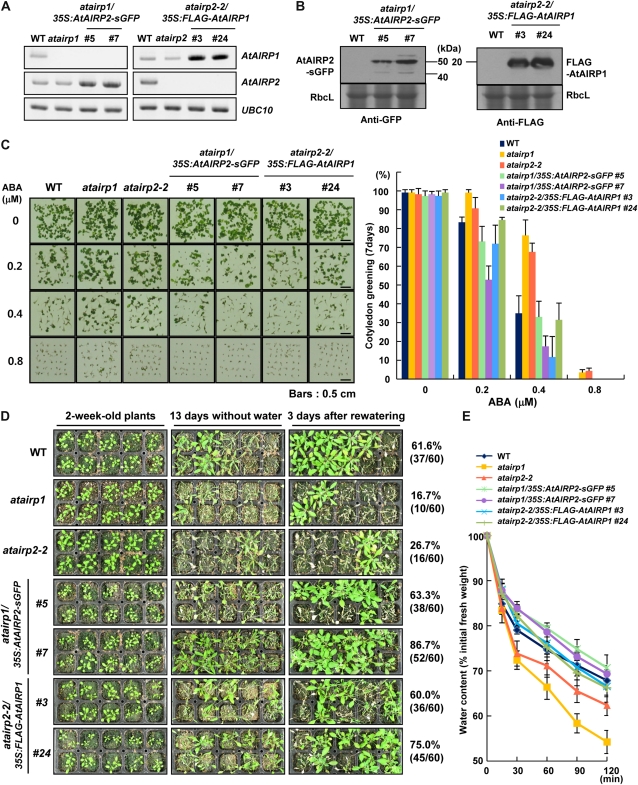
Figure 8.
Construction and characterization of atairp1/35S:AtAIRP2-sGFP and atairp2-2/35S:FLAG-AtAIRP1 complementation transgenic plants. A and B, RT-PCR and immunoblot analyses. AtAIRP2-sGFP and FLAG-AtAIRP1 fusion genes were ectopically expressed in atairp1 and atairp2-2 mutant plants, respectively. Transcript (A) and protein (B) levels of AtAIRP2-sGFP and FLAG-AtAIRP1 were examined in atairp1/35S:AtAIRP2-sGFP (lines 5 and 7) and atairp2-2/35S:FLAG-AtAIRP1 (lines 3 and 24) complementation T3 transgenic plants. Rubisco large subunit (RbcL) was used as a loading control. C, Phenotypic properties of atairp1/35S:AtAIRP2-sGFP and atairp2-2/35S:FLAG-AtAIRP1 complementation T3 transgenic plants during the germination stage. After imbibition in water for 2 d at 4°C, wild-type (WT), atairp1 and atairp2-2 mutant, and atairp1/35S:AtAIRP2-sGFP and atairp2-2/35S:FLAG-AtAIRP1 complementation T3 seeds were treated with different concentrations of ABA (0, 0.2, 0.4, and 0.8 μm) at 22°C under a 16-h-light/8-h-dark photoperiod. Germination percentages were determined in terms of cotyledon greening 7 d after germination. sd values were determined from four biological replicates (n = 40). Bars = 0.5 cm. D, Water stress tolerance of atairp1/35S:AtAIRP2-sGFP and atairp2-2/35S:FLAG-AtAIRP1 complementation T3 transgenic plants. Light-grown, 2-week-old wild-type, atairp1 and atairp2-2 mutant, and atairp1/35S:AtAIRP2-sGFP (lines 5 and 7) and atairp2-2/35S:FLAG-AtAIRP1 (lines 3 and 24) complementation T3 transgenic plants were further grown for 13 d without irrigation. Water-stressed plants were irrigated, and their survival ratios were determined after 3 d of irrigation. E, Water loss rates of detached rosette leaves. Mature rosette leaves from 2-week-old wild-type, atairp1 and atairp2-2 mutant, and atairp1/35S:AtAIRP2-sGFP (lines 5 and 7) and atairp2-2/35S:FLAG-AtAIRP1 (lines 3 and 24) complementation T3 transgenic plants were detached, and their fresh weights were measured at the indicated time points. Water loss rates were calculated as the percentage of fresh weight of the excised leaves. Data represent means ± sd (n = 7) from three independent experiments. [See online article for color version of this figure.]

