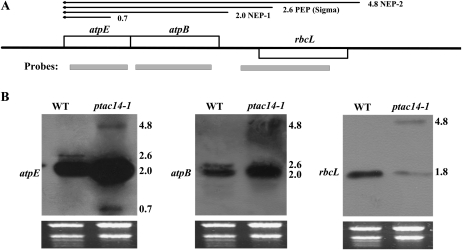
Figure 6.
Transcript pattern analysis by probes spanning distinct portions of the atpE-rbcL region in the wild type (WT) and ptac14-1 mutants. A, Coding regions (boxes), positions of probes (gray bars), and transcripts (arrows in the 5′ to 3′ direction; sizes in kb). B, Transcripts after northern-blot hybridization analysis. A total of 10 μg of RNA was loaded per lane.

