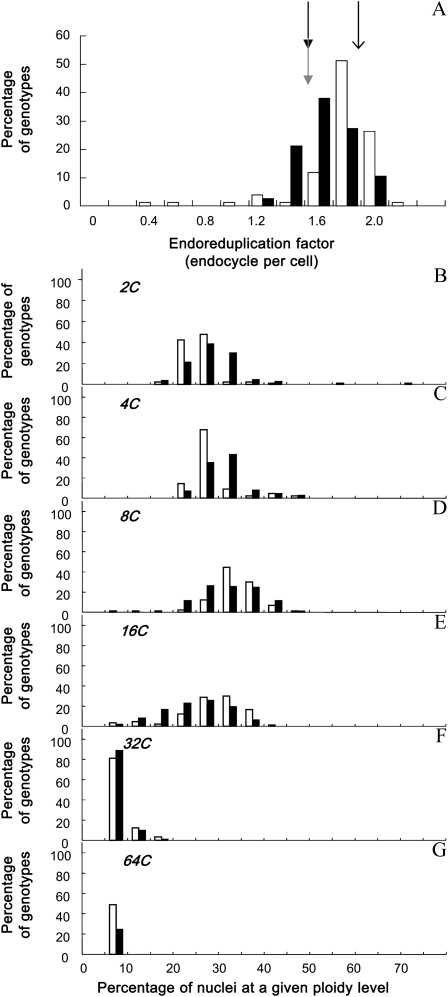
Figure 2.
Variation of endoreduplication in the two sets of genotypes. Frequency distribution of EF (A) and the percentage of nuclei in 2C (B), 4C (C), 8C (D), 16C (E), 32C (F), and 64C (G) are shown. Genotypes are divided into two groups: the mutant collection (white bars) and the Ler × An-1 RIL population (black bars). In A, mean values of EF are shown by an arrow for Col-0 and by gray and black arrows for An-1 and Ler, respectively.

