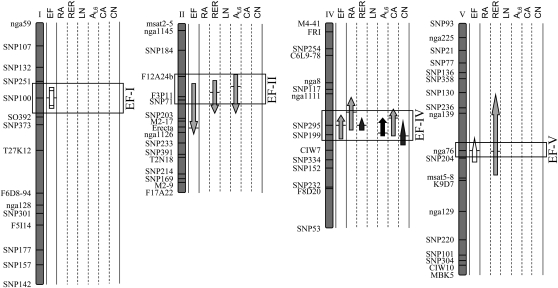
Figure 5.
Ler × An-1 linkage map showing QTLs for EF and other leaf growth variables. For each variable (EF, rosette area [RA], rosette relative expansion rate [RER], number of rosette leaves [LN], leaf 6 area [AL6], epidermal cell area [CA], and number [CN]), QTLs are represented by arrows along the chromosomes. The locations of all QTLs identified are shown as 95% Bayes credible intervals, with the positions of horizontal bars corresponding to the maximum LOD score values. The direction of the arrows indicates the sign of the additive effect: arrows pointing upward indicate that Ler alleles have a positive effect (i.e. they increase the values of the trait). The shape of the arrows indicates the nature of the QTL: main effects (headed arrows), in epistatic interaction (nonheaded arrows), and epistatic QTLs with no main effect (rectangle). The gray scale of the arrows indicates the percentage of phenotypic variance explained by the QTL: 0% to 10%, 10% to 20%, 20% to 30%, and 30% to 100% from lightest to darkest.

