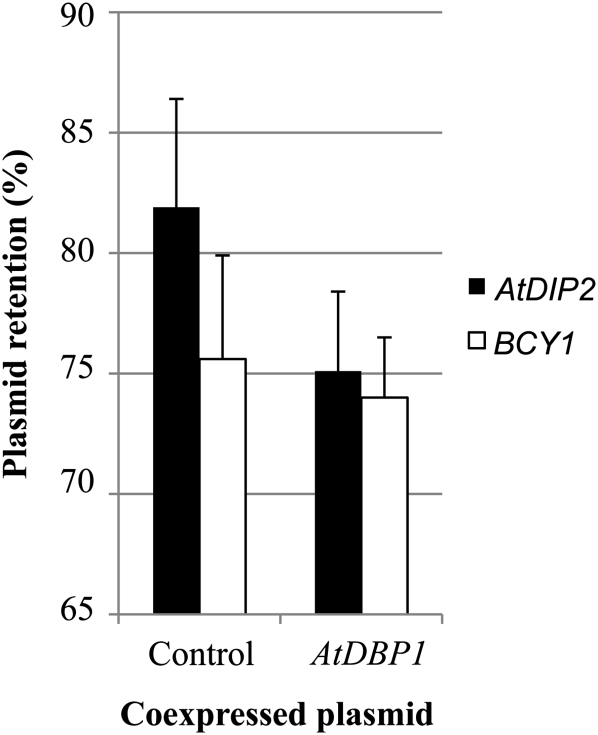
Figure 4.
Functional interference between AtDIP2 or an unrelated yeast gene, BCY1, and AtDBP1. Data shown are percentages of colonies retaining the plasmid driving the expression of AtDIP2 (black bars) or BCY1 (white bars) in the two-streak test as described in “Materials and Methods.” The plasmid bears the ADE2 marker, so cells that lose the plasmid (and thus their resulting colonies) appear red due to the accumulation of derivatives of the substrate of the ADE2 enzyme, whereas cells harboring the plasmid and therefore endowed with ADE2 activity appear white. The proportion of white colonies in the population when coexpressed with AtDBP1 or with the corresponding empty vector is shown as the mean ± sd of 12 experiments in the case of AtDIP2 and at least four experiments for BCY1.

