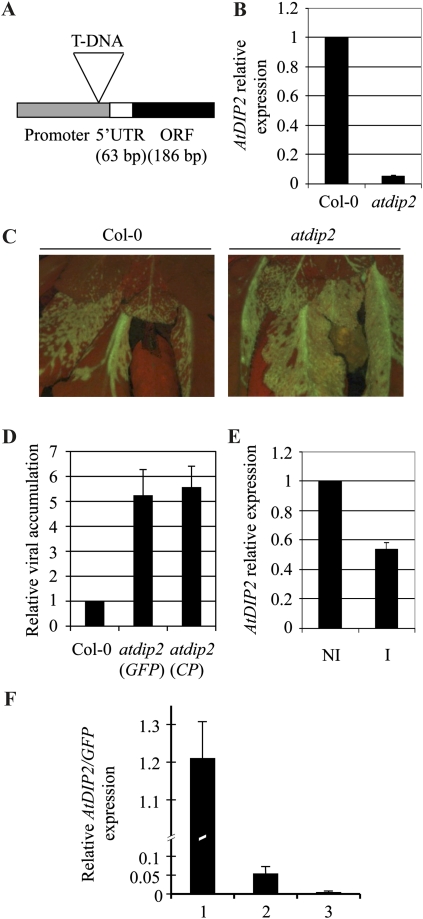
Figure 5.
Molecular and phenotypic characterization of the atdip2 mutant. A, Diagram showing the position of the T-DNA insertion in the AtDIP2 gene relative to the promoter of the gene and the transcribed region in the SALK_131929 line. ORF, Open reading frame; UTR, untranslated region. B, RT-qPCR with primers specific for the AtDIP2 gene. RNA was extracted from rosette leaves of 4-week-old plants. Expression data were normalized using ACT2/8 and referred to Col-0. The average ± sd of three experiments is shown. C, Fluorescence microscopy image of Col-0 (left panel) and atdip2 (right panel) plants infected with a GFP-tagged PPV infectious clone at 21 d post inoculation (dpi). D, Accumulation of viral RNA in the atdip2 mutant relative to Col-0 plants as measured by RT-qPCR with primers specific both for the GFP gene and the viral CP gene. RNA was extracted from the rosettes of infected plants at 21 dpi. Data were normalized using ACT2/8 and referred to Col-0. The average ± sd of three experiments is shown. E, AtDIP2 gene expression in PPV-infected Col-0 plants at 21 dpi analyzed by RT-qPCR. Data were normalized using ACT2/8 and referred to the expression level in noninoculated plants. NI, Noninoculated plants; I, inoculated plants at 21 dpi. The average ± sd of three experiments is shown. F, AtDIP2 gene expression referred to the accumulation of viral RNA during the PPV infection process. Expression was measured by RT-qPCR, normalized using ACT2/8 expression, and referred to the similarly normalized data of viral GFP RNA. RNA was extracted from infected leaf material showing low (bar 1), medium (bar 2), and high (bar 3) PPV accumulation, as detected by fluorescence microscopy. [See online article for color version of this figure.]

