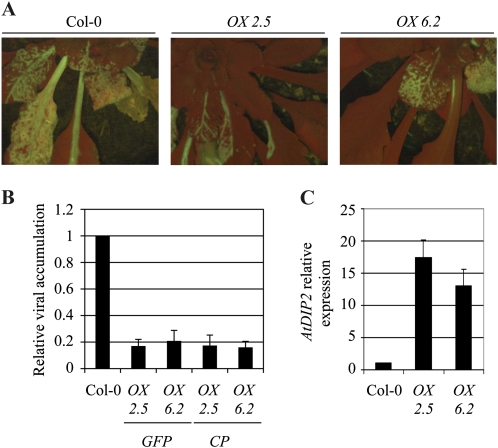
Figure 6.
Analysis of PPV infection in AtDIP2-overexpressing plants. A, Fluorescence microscopy image of representative plants of Col-0 (left panel) and of two independent AtDIP2-overexpressing lines (middle and right panels), infected with a GFP-tagged PPV infectious clone, at 21 d post inoculation (dpi). B, RT-qPCR with primers specific for the GFP and CP genes. RNA was extracted from the rosettes of infected plants 21 dpi. Data were normalized using ACT2/8 and referred to Col-0. The average ± sd of three experiments is shown. C, AtDIP2 gene expression in the overexpressing plants analyzed by RT-qPCR. Data were normalized using ACT2/8 and referred to Col-0. The average ± sd of three experiments is shown. [See online article for color version of this figure.]

