Figure 1.
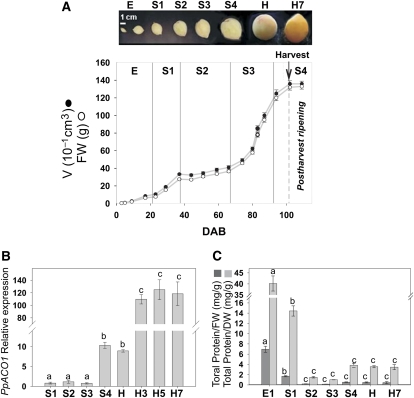
Dixiland peach fruits during development. A, Peach fruit growth curve. Volume (V) and fresh weight (FW) variations are shown for peach fruits collected during 2008 at early (E) fruit development (3, 5, 9, and 17 DAB) and stages S1 (23, 29, and 37 DAB), S2 (44, 51, 59, and 66 DAB), S3 (74, 80, 83, and 87 DAB), and S4 (94 and 102 DAB). Peach fruits were harvested at 102 DAB (H), as indicated by the arrow, and allowed to ripen at 20°C for 7 d (H7). A photograph of typical peach fruits at each developmental stage is shown in the top panel. B, PpACO1 expression during peach fruit development. Peach fruits were collected at 29 (S1), 51 (S2), 80 (S3), 94 (S4), and 102 (H) DAB and at 3, 5, and 7 DAH (H3, H5, and H7, respectively), and PpACO1 levels were analyzed by qRT-PCR. The means of the results obtained, using three independent RNAs as templates, are shown. Each reaction was normalized using cycle threshold (Ct) values corresponding to EF1α from peach. The y axis shows the fold difference in the PpACO1 level relative to the amount found in peach fruits at S1. sd values are shown. Bars with the same letters are not significantly different (P < 0.05). C, Total protein level variation during peach fruit development. Total protein ratios relative to either dry weight (DW) or fresh weight (FW) during peach fruit development at 9 (E1), 29 (S1), 51 (S2), 80 (S3), 94 (S4), and 102 (H) DAB and 7 DAH (H7) are shown. Values represent means of 15 independent determinations using different fruits. sd values are shown. Bars with the same letters are not significantly different (P < 0.05). [See online article for color version of this figure.]

