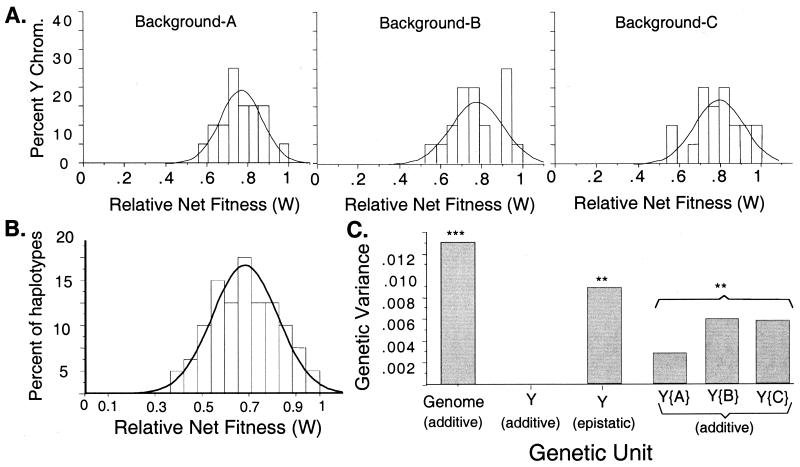
Figure 2.
The phenotypic distribution of relative net fitness (W) for the 20 sampled Y chromosomes in three different genetic backgrounds (A, B, and C) in A, and the benchmark sample of 69 genomic haplotypes in B. Each fitness measure is the average from 3 replicates, and in each replicate, the genomic haplotype was expressed in an average of 35 different genetic backgrounds (chromosomes Y, II, and III). (C) Comparison of the genetic variances of the 20 Y chromosomes (Table 1) to that of the 69 benchmark genomic haplotypes. The designation Y{i} represents the additive genetic variance among Y chromosomes within genetic backgrounds i = A, B, or C. ***, P < 0.001; **, P < 0.01, for :Ho. Genetic variance = 0.

